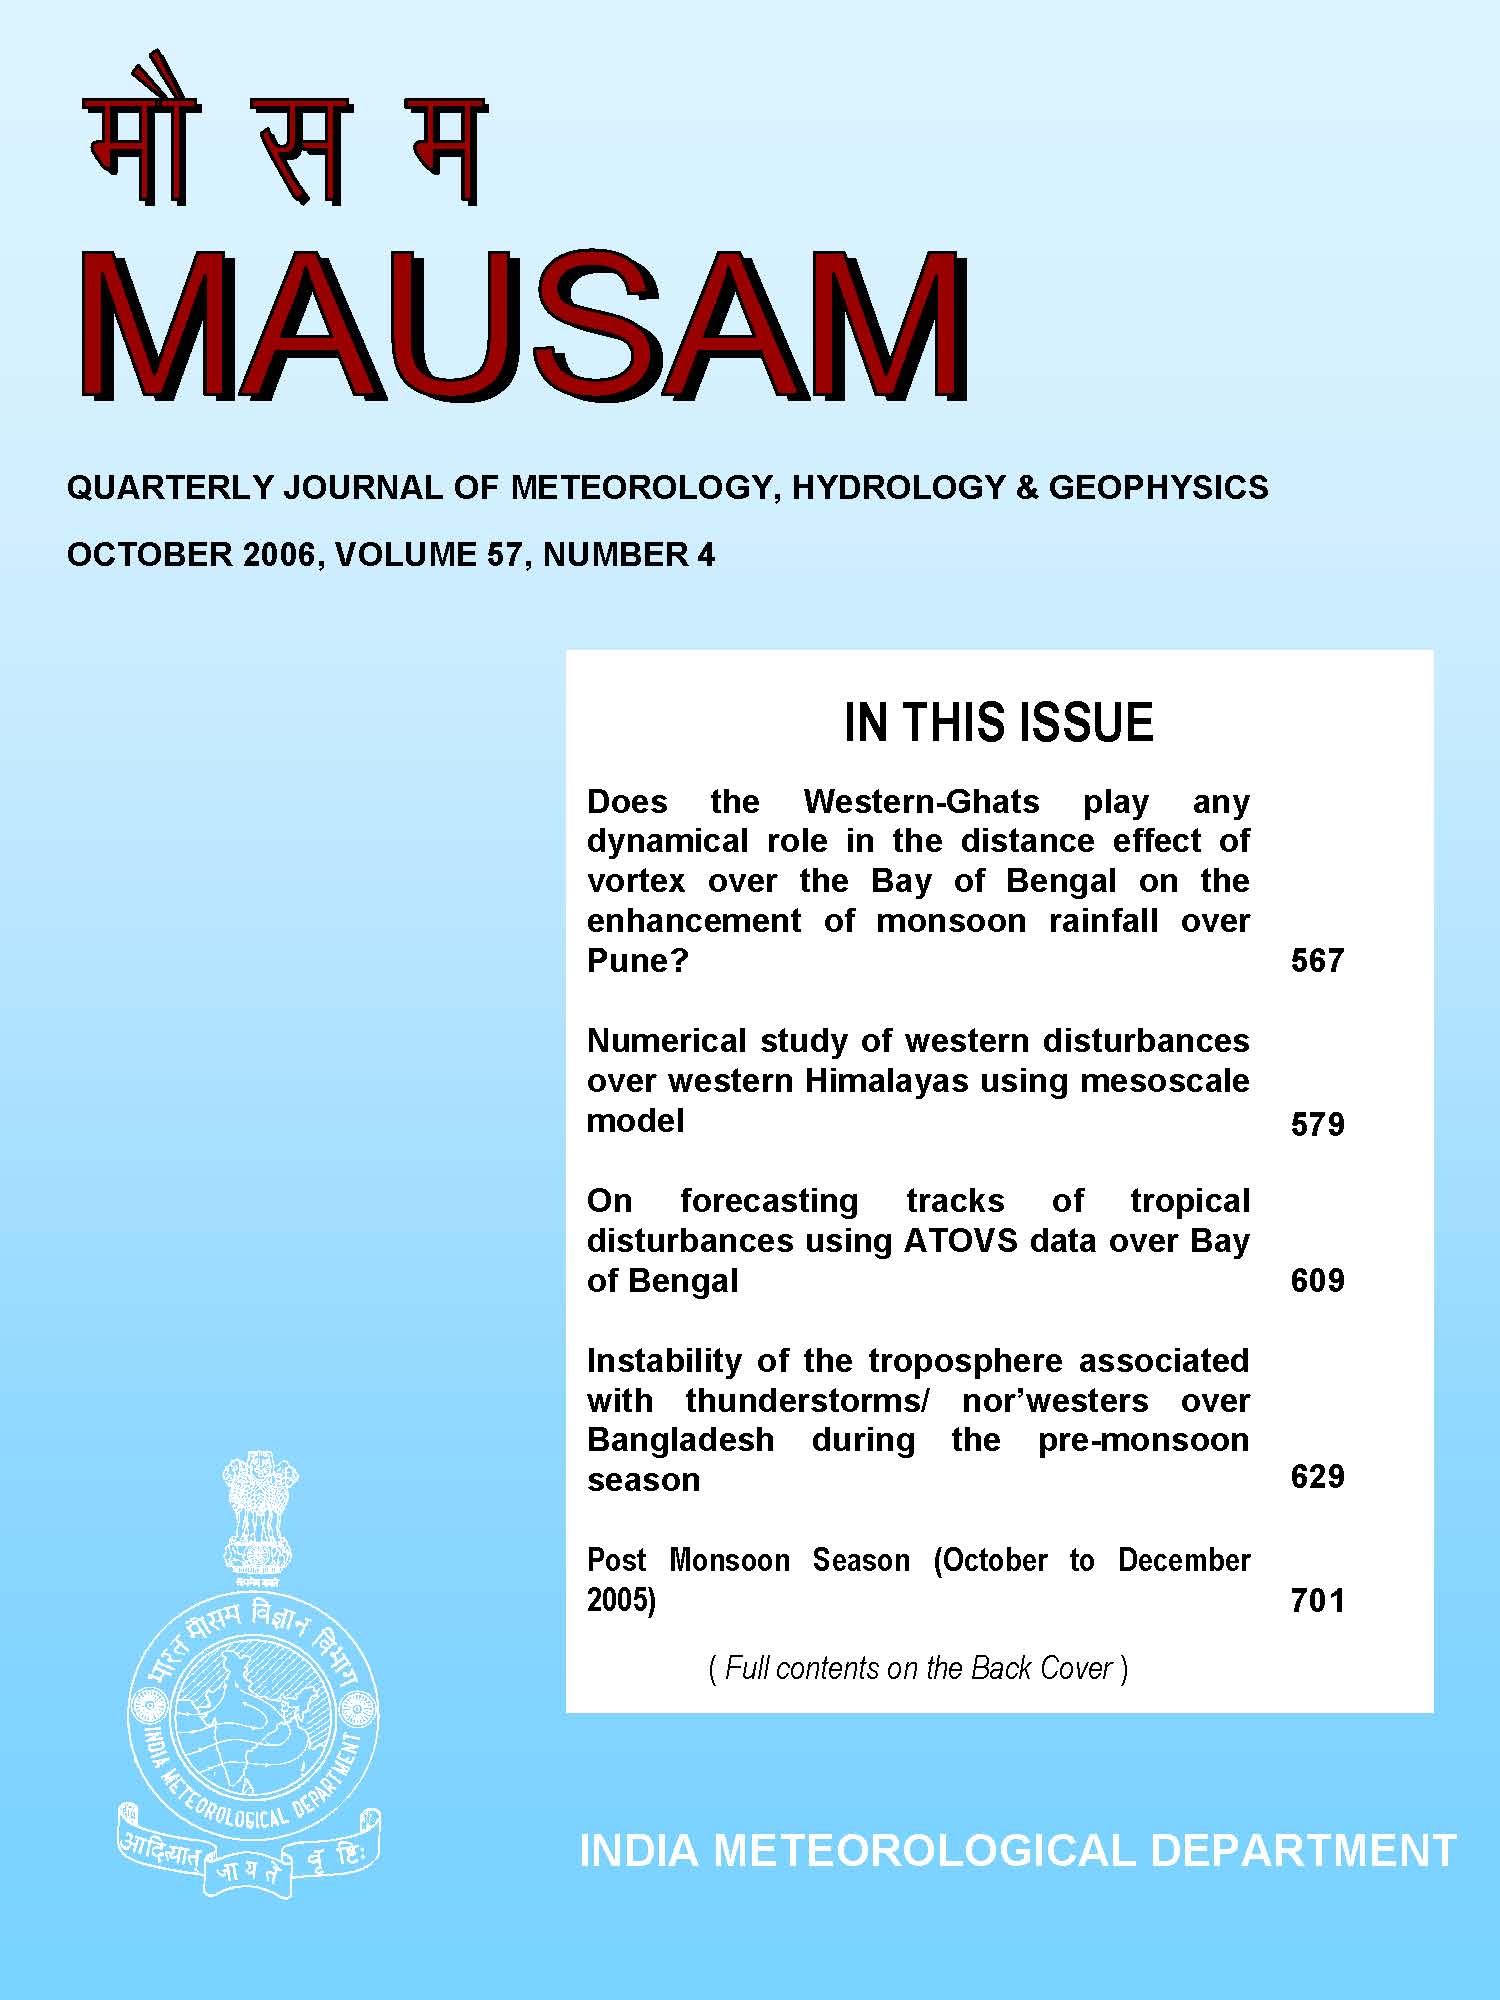
Spectral characteristics of Atlantic seasonal storm frequency
DOI:
https://doi.org/10.54302/mausam.v57i4.499Abstract
lkj & o"kZ 1900&2000 dh vof/k esa vVykafVd egklkxj dh rwQkuh xfrfof/k ¼ftUgas rwQku] izpaM rwQku] vkfn uke fn, x, gaS½ ds fofHkUu lwpdkadksa ds dky Jsf.k;ksa dk vuqØe fo’ys"k.k ,e-b-,e-¼vf/kdre ,uVªkWih fof/k½ }kjk rFkk mldh vkofrZrk ds vk;ke ,e- vkj- ,- ¼cgqq lekJ;.k fo’ys"k.k½ }kjk izkIr fd, x, gaSA fiNys dqN o"kksZa ds vkadM+ksa ¼o"kZ 1950 ls vkxss½ ds vuqlkj budh egRoiw.kZ vkofrZrk,¡ n’kd lfgr( f}okf"kZd dYi] f=okf"kZd dYi {ks=ksa rFkk buls mPp {ks=ksa esa Hkh jghA 2-40 o"kkasZ esa 50 feyhckj ds fuEu v{kka’k {ks=h; iou vkSj 2-40 ,oa 2-85 o"kkasZ ds b- ,u- ,l- vks- ¼,y uhuks/nf{k.kh nksyu½ ?kVuk ds ln`’k f}o"khZ dYi nksyu {ks= esa ¼3&4 o"kkasZ½ rwQku lwpdkad 2-40 rFkk 2-85 o"kksZa ds djhc pje ij jgsA mPp vkofrZrk okys {ks=ksa esa rwQku lwpdkad 4-5&5-5-] 8&9] 11&12 rFkk 14&15 o"kkasZ esa pje ij jgs tcfd b- ,u- ,l- vks- 7-4 ,oa 12&14 o"kksZa esa pje ij jgsA cgq n’kdh; Js.kh esa 28&34]40]50&53]61&63]~70 ,oa ~80 o"kksZa esa ¼ijUrq fHkUu lwpdkadksa ds fy, fHkUu&fHkUu½ rwQku pje ij jgs tks LFky ,oa leqnzh lrg ds rkiekuksa ds leku pje ekuksa ds vuq:Ik jgsA dqy lwpdkadksa esa 90 o"kkZsa esa yxHkx 50 izfr’kr dh m/oZ izo`fr jghA
The time series of the various indices of Atlantic storm activity (number of named storms, hurricanes, etc.) for 1900-2000 were subjected to spectral analysis by MEM (Maximum Entropy Method) and amplitudes of the periodicities were obtained by MRA (Multiple Regression Analysis). For recent data (1950 onwards), significant periodicities were in the quasi-biennial, quasi-triennial regions and also in higher regions, including decadal. In the QBO region (2-3 years), storm indices had peaks near 2.40 and 2.85 years, similar to 2.40 years of 50 hPa low latitude zonal wind and 2.40 and 2.85 years of ENSO (El Niño/Southern Oscillation) phenomenon. In the QTO region (3-4 years), storm indices and ENSO had common peaks near 3.5 years. In higher periodicity regions, storm indices had peaks at 4.5-5.5, 8-9, 11-12 and 14-15 years, while ENSO had peaks at 7.4 and 12-14 years. In the multi-decadal range, storm peaks were at 28-34, 40, 50-53, 61-63, ~70 and ~80 years (but different for different indices), which matched with similar peaks in land and sea surface temperatures. Some indices had large uptrends, ~50% in 90 years.Downloads
Published
How to Cite
Issue
Section
License
Copyright (c) 2021 MAUSAM

This work is licensed under a Creative Commons Attribution-NonCommercial 4.0 International License.
All articles published by MAUSAM are licensed under the Creative Commons Attribution 4.0 International License. This permits anyone.
Anyone is free:
- To Share - to copy, distribute and transmit the work
- To Remix - to adapt the work.
Under the following conditions:
- Share - copy and redistribute the material in any medium or format
- Adapt - remix, transform, and build upon the material for any purpose, even
commercially.


